
White people are 62 percent of the population (and falling).
White people constituted 71 percent of all voters in the 2016 General Election (partly from turnout, partly from voter suppression)
White voters favored Trump over Clinton 57 to 37 (most 3rd Party votes were for Libertarians, with a few for Greens).
Latin@s were 18 percent of the population and 10 percent of voters. CLOSING THIS GAP WOULD HELP.
Latin@s favored Clinton over Trump 67-28, with concentration of Trump-Latin@s among Floridian Cuban Americans. Obama won Latin@s with 71 percent, four points ahead of Clinton.
African Americans were 14 percent of the population and 13 percent of voters.
African Americans favored Clinton over Trump 88 to 8, with some young black voters drifting to the Greens. Obama received 93 percent of the black vote in 2012, five points ahead of Clinton.
Asian Americans were 5 percent of the population and between 3-4 percent of voters. Asian Americans favored Clinton over Trump at 65 to 27. 73 percent Asian Americans voted for Obama in 2012, a difference of eight points.
Other non-white voters constituted 2-3 percent.
Since 2006, the Democratic Party has steadily lost electoral shares in every general and off-year elections, in every single group.
In the 2016 GE, Clinton received 55 percent of the 18-29 year-old vote, with Trump receiving 37 percent.
Clinton received 50 percent of the 30-44 year-old category, with Trump at 37.
Clinton received 44 percent of 45-64 year-olds, with Trump winning 53 percent.
Clinton and Trump's shares were 45-53 respectively among voters 65 and up.
During the Democratic Primaries in 2016, ages 18-44 went for Sanders, with 60 percent for Sanders among whites and 49 percent of non-whites for Sanders. Clinton ran slightly ahead among white voters 45 and over, but the biggest gap was non-white voters over 45 years-old, which Clinton won by more than 40 percent.
30-44 turns out at about 60 percent.
18-29 turns out at about 45 percent. RAISING THIS BY TEN WOULD BE A GAME CHANGER.
By 2032, whites will lose their majority status and become a dominant plurality.
Here are the median ages for each state.
Here are the median ages for each county.
Here is a racial diversity map for each county.
More cool maps.
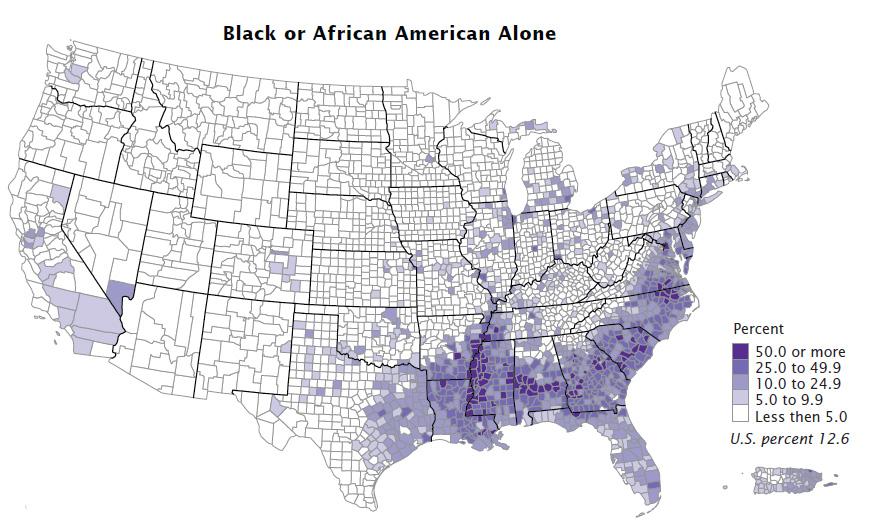
African American population by county map.
Latin@ population by county.
I contend that Sanders would have beaten Trump, but we'll never know, will we?
But what I will say is that by 2020, the demographics favor Sandercrats in electoral challenges within the Democratic Party; and they will be well-positioned (IF YOUTH IS MOBILIZED) to defeat Republicans en masse.
No comments:
Post a Comment